


Analytics
Usage and billing
Review customer-scoped workspace runtime, managed ArchiBot AI activity, platform resource usage, reconciliation posture, and billing readiness across the Analytics tabs, and set spending caps.
Last updated
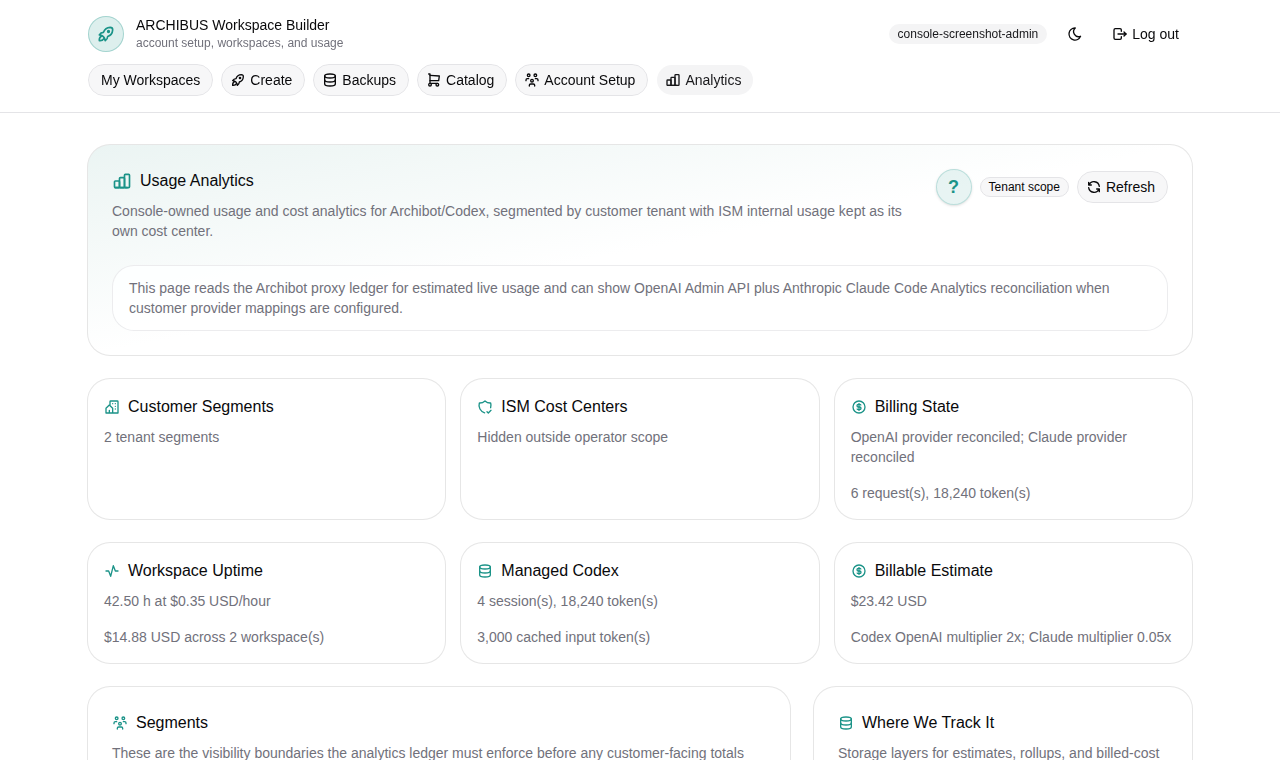
Analytics is where you review how a customer account is using ArchiBot: workspace runtime, managed ArchiBot AI, platform resources such as CI and Shared Drive, reconciliation posture, and billing readiness. It lives at Analytics in the Console navigation and is the same surface support uses for billing handoff.
This guide describes the page as it renders today: a selectable time window, a shared filter bar, role-gated metric cards, six tabs, and a Spending caps tab that writes monthly caps back to the usage ledger.
Who can view usage
What you see depends on your role.
| Role | What Analytics shows |
|---|---|
| Customer member | Your own usage posture for your tenant only. No customer-wide totals, no sibling-user usage, and no billing amounts. |
| Customer admin | Your customer account, including billable estimates, member breakdown, workspaces, and Spending caps for the selected customer. |
| Platform operator / billing operator | Cross-customer review with provider cost and gross-margin context for onboarding, support, and billing handoff. |
If your account has no tenant membership yet, Analytics tells you so and waits until onboarding creates a tenant before it scopes usage. Account access and role mapping are covered in Access roles.
The window and filter bar
Use the time window control in the top bar to report the trailing 7, 30, or 90 days (30 is the default). Changing it reloads every tab for that window. The active scope and window are also summarized in the Window snapshot panel on the right.
At the top of the page a shared bar drives every tab:
- Search filters users, services, workspaces, and usage rows.
- The service filter (the all control) narrows to a single billable service, for example workspace runtime or managed AI.
- The customer selector (admins and operators only) chooses All visible customers or one customer account. Members do not see this selector because they are already scoped to themselves.
- The time window control switches the whole page between the last 7, 30, or 90 days.
- Refresh reloads usage and spending caps.
The customer you pick in this bar is the scope for the Members, Workspaces, and Spending caps tabs. Confirm it before reading or changing anything.
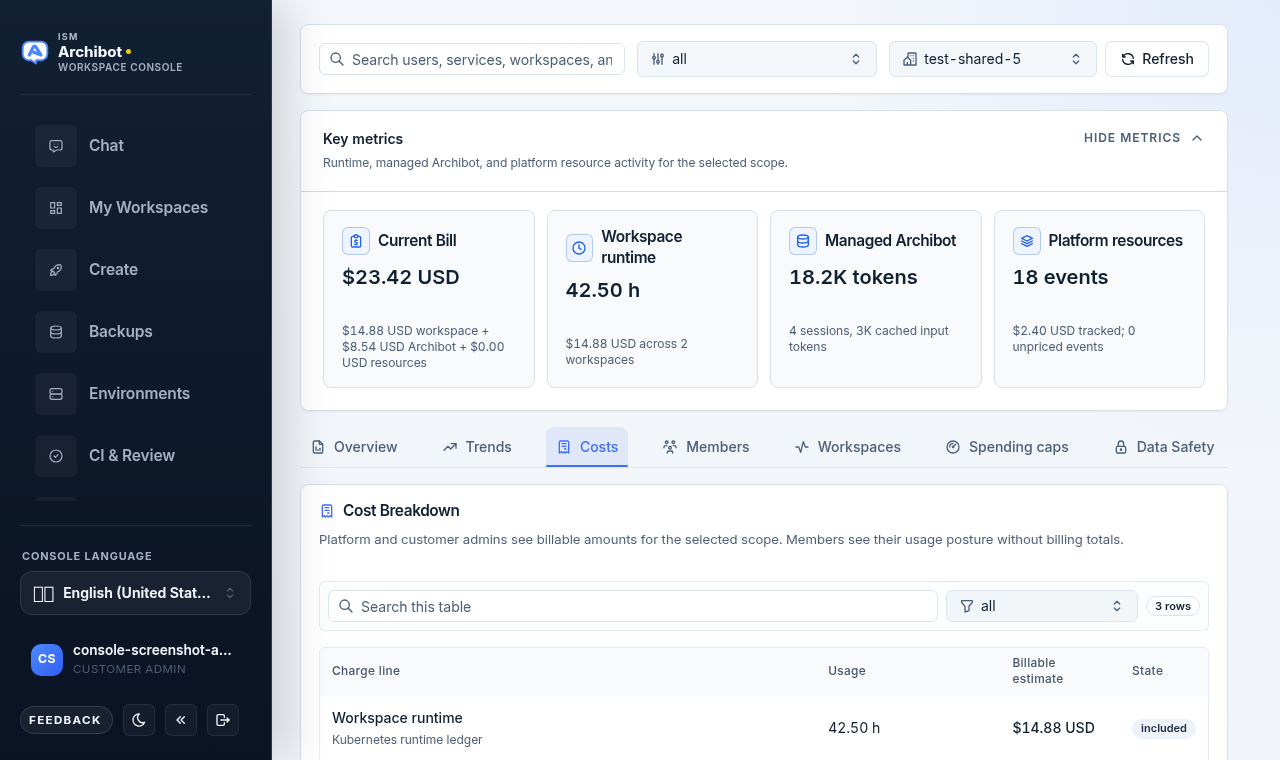
Key metrics
Below the filter bar, the Key metrics cards summarize the window. The cards shown depend on your role:
| Card | Meaning | Visible to |
|---|---|---|
| Current Bill | Customer-facing billable estimate for the window, broken down by workspace, ArchiBot, and resources. | Admins and operators |
| Workspace runtime | Observed workspace hours, from the billing-grade Kubernetes ledger when available. | Everyone |
| Provider cost | Reconciled provider-side cost and provider status. | Operators only |
| Gross margin | Known-cost gross margin against the target. | Billing operators only |
| Managed ArchiBot | Managed ArchiBot AI token totals and session counts from session metadata. | Everyone |
| Platform resources | Count of CI, review, QA, persistent environment, and Shared Drive events, with any unpriced events noted. | Everyone |
You can collapse this block with Hide metrics and reopen it with Show metrics.
The six tabs
Analytics organizes detail into tabs. Two of them (Members and Spending caps) are hidden for members.
| Tab | What it covers |
|---|---|
| Overview | Billable-estimate or usage-over-time chart, the current-window summary, and a collapsible Scope and accuracy note. |
| Trends | Daily series so you can spot spikes before reading line items. |
| Costs (Usage for members) | Cost or usage breakdown by charge line and resource showback. |
| Members | Workspace runtime, managed AI, and resource events grouped by member. Admins and operators only. |
| Workspaces | Runtime-over-time chart, runtime consensus, and a per-workspace table. |
| Spending caps | Per-service monthly caps, edited from a member roster. Admins and operators only. |
The third tab is labeled Costs when you can see billable amounts and Usage for members who cannot.
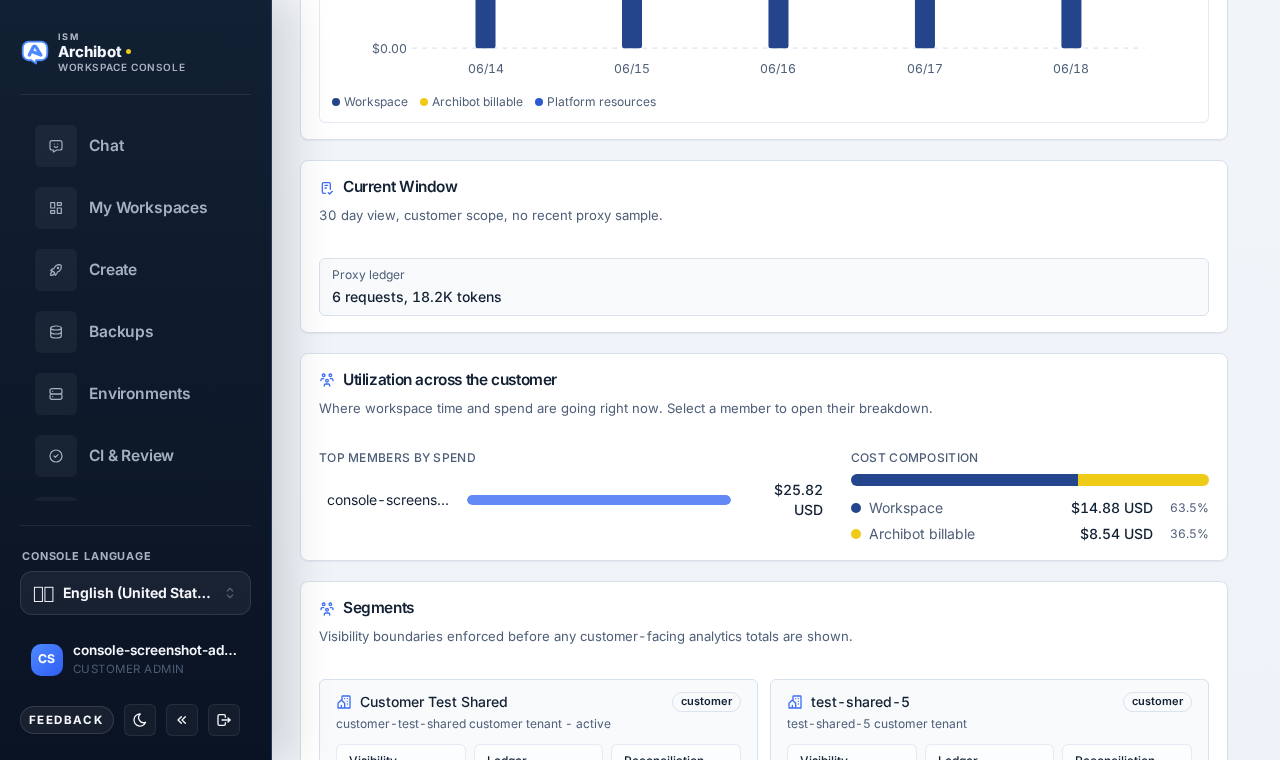
Overview and Trends
Overview opens by default. It shows the billable-estimate-over-time chart (or usage-over-time for members) and a current-window summary describing the day count, scope, and coverage. Below those, Utilization across the customer ranks your top members by spend (or by workspace hours when amounts are hidden) and breaks total cost into its workspace, managed-AI, and platform-resource shares — select a member’s bar to jump straight into their breakdown on the Members tab. Trends breaks the same data into a daily series; use the Metric control there to switch the main chart between billable cost, workspace hours, provider tokens, proxy requests, and Codex sessions, so you can read momentum and catch a spike before opening individual line items.
Costs
The Costs tab (shown above) lists each charge line with its usage and, for admins and operators, a billable estimate and included or over-allowance state. Use the table search to narrow rows.
Two callouts may appear here:
- A current bill estimate banner restates the window total. This is showback guidance for the selected window; Stripe meter exports and prepaid debits remain controlled by backend jobs.
- For billing operators, a gross margin callout compares known-cost margin to the target.
A Resource Showback card lists metadata-only usage for CI, review, QA, persistent environments, and Shared Drive, with actor attribution and resource allowances. If any rows are still unpriced, an amber note names the resource kinds that need pricing.
Members
The Members tab groups workspace runtime, managed AI, and resource events by member for the selected window and customer. Use it to see which members drive activity. It is hidden for member-role accounts.
Workspaces
The Workspaces tab shows a runtime-over-time chart and a Runtime Consensus panel comparing the Kubernetes ledger hours, the Coder build-history comparison, and the drift between them. Below that, the Workspace Breakdown table lists each workspace with its owner, runtime, billable estimate (for admins and operators), and last-observed time.
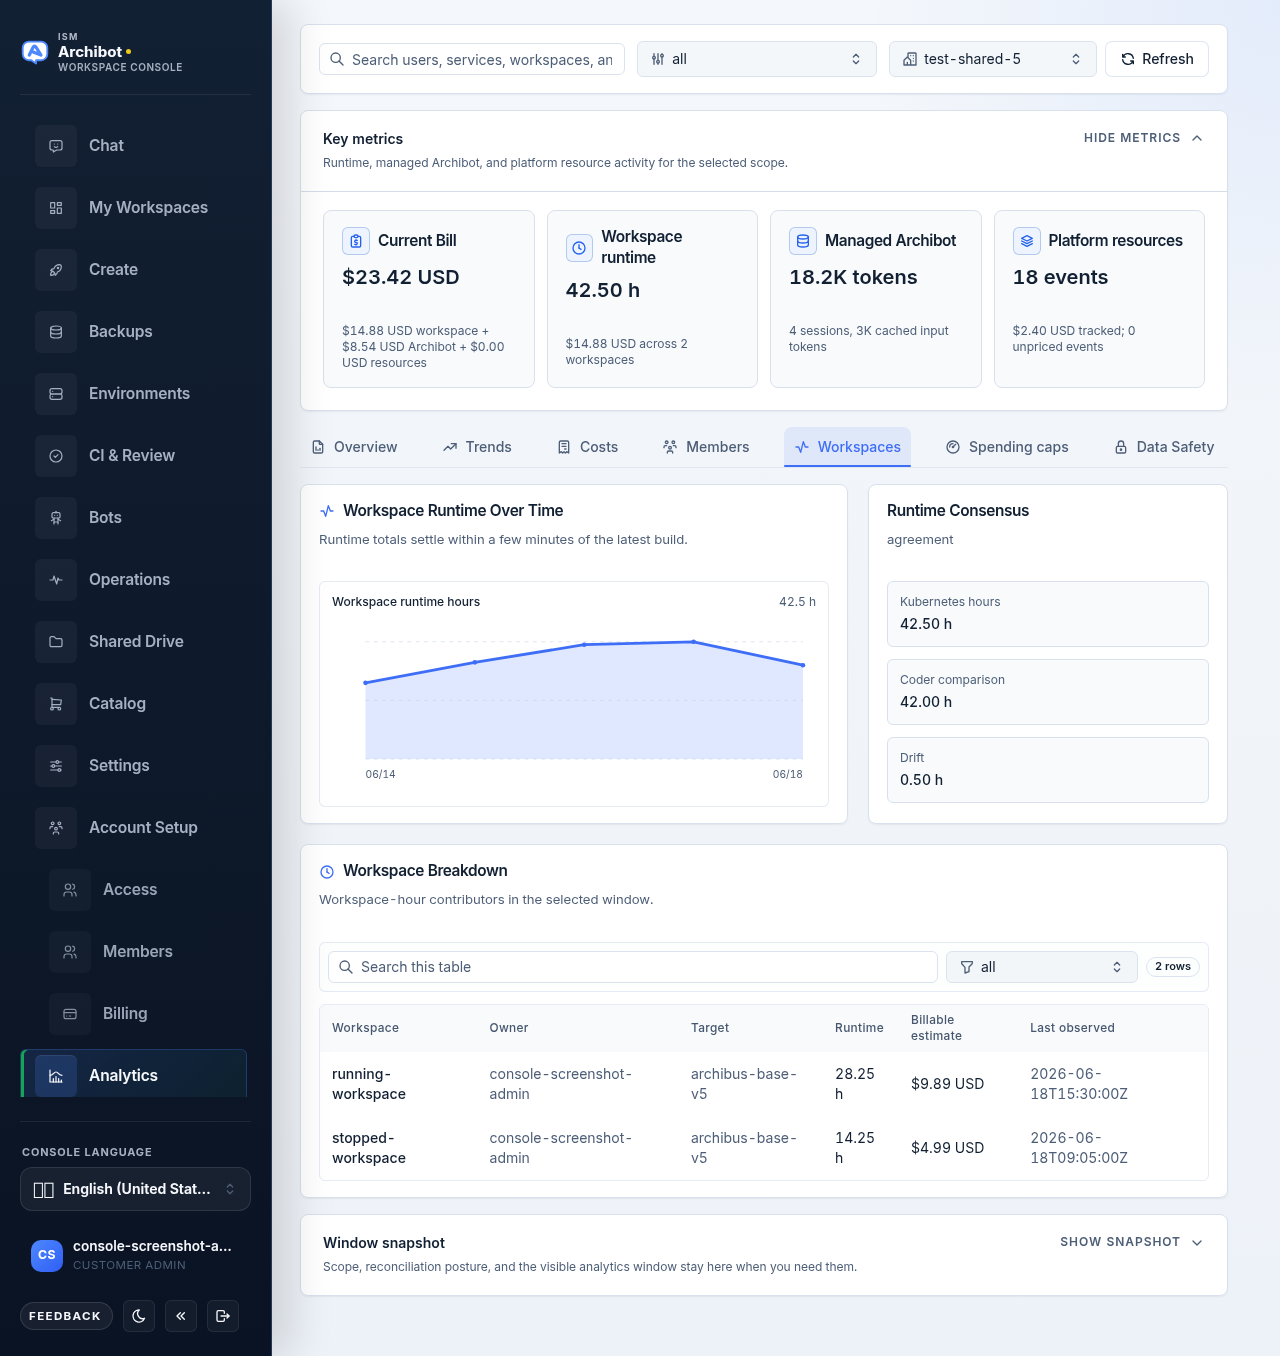
Runtime is shown from the billing-grade Kubernetes ledger when available and falls back to Coder build history otherwise; the table labels the source.
Spending caps
The Spending caps tab is a write surface for customer admins and operators. Select a single customer account in the filter bar first; with All visible customers selected the tab asks you to choose one account.
You set caps per scope, not in one flat grid. Pick a scope from the roster on the left, then edit that scope’s per-service caps on the right.
Customer rollup cards sit across the top:
- Total spend against the sum of configured caps for the customer.
- Over cap — how many scopes are above their cap.
- Near cap — how many scopes are at 80 percent or more.
- Active caps — how many caps are active across all scopes.
Each card is colored within, near, or over cap so you can read posture at a glance.
The scope roster is the left column. Customer default is pinned first (it applies to every member without an override), then each member. Above the list you get:
- a Search members box,
- a sort control — Sort by cap usage or Sort by name,
- a status filter (All states, Active, Paused),
- an enforcement filter (All enforcement, Alert only, Block new work).
Every roster entry shows its total spend, a percent-of-cap figure, a colored progress bar, and a within/near/over cap badge.
The per-service form opens on the right when you select a scope. It repeats the scope’s spend, over-cap, and near-cap rollup cards, then lists one card per billable service (workspace runtime, managed AI, CI, review, QA, persistent environments, Shared Drive). Each service card carries:
| Field | What it does |
|---|---|
| Service name | The billable service the cap applies to, plus its description. |
| Current usage | Spend and quantity observed in the window, shown as gauge bars. |
| Monthly spend cap | The monthly dollar cap. Set to 0 to leave the dollar cap off. |
| Monthly usage cap | The monthly quantity cap for the service unit. Set to 0 to leave it off. |
| Cap action | How the cap behaves: Alert only, Block new work, or Disabled. |
| State | Whether the cap is Active or Paused. |
| Data state | A Within cap, Near cap, Over cap, or No cap set badge, plus any badges for missing cost or attribution data. |
| Save | Writes that service’s cap. |
Each service card shows two gauge bars — spend vs. spend cap, and usage vs. usage cap — colored within, near, or over cap. Below the cards, a Customer rollup by service panel aggregates every scope’s spend against its caps, one bar per service.
To change a cap, edit a service card and choose Save on that card. Each service saves independently, and Save stays disabled until you change something. Console stores these policies alongside the usage ledger so billing and launch gates read one source.
A separate Data gaps card lists services that still need attribution or pricing before a cap can become hard enforcement. If a service shows a missing-data badge, set the cap action to Alert only until the underlying data is complete; Block new work depends on accurate attribution.
How costs are calculated
The Console no longer shows an Accuracy Disclaimers card, but the cost-math rules still hold. Keep them in mind when you read or quote a number:
- Failed managed-AI calls that carry no usage counters are not debited.
- Managed AI is included in billable estimates only once reconciliation is complete for the visible scope. An unreconciled window can read low by design.
- Billable estimates appear for platform and customer admins, then settle after provider Admin API windows and Stripe meter exports close. Estimates are showback guidance, not the invoice.
- Workspace runtime comes from the billing-grade Kubernetes ledger when available and falls back to Coder build history otherwise. The Workspaces table labels the source.
The Overview tab keeps a short Scope and accuracy note covering this reconciliation boundary; expand it with Show notes when you need it on screen.
What analytics does and doesn’t store
The Console no longer has a Data Safety tab, but the storage posture is unchanged. This is the reference for what Analytics keeps and what it never touches:
- Estimates, rollups, and billed-cost allocation are the only cost layers stored.
- Raw prompts, model responses, full transcripts, raw provider keys, and private policy assets stay out of analytics and invoice-support exports.
- Only minimum metadata fields are kept for customer-safe analytics.
- Live proxy usage from the ArchiBot proxy ledger is tracked separately from reconciled provider billing, so the two can differ.
Treat usage data as account evidence. It should never include prompts, responses, transcripts, raw provider payloads, API keys, cookies, or workspace secret values.
Reconciliation posture
Provider reconciliation can lag provider billing systems by about a day, and Admin API windows settle after the fact. The Window snapshot and provider posture panels on the right show the current reconciliation state.
If a recent number looks low or missing, check the reconciliation posture before escalating. Managed AI is included in billable estimates only once reconciliation is complete for the visible customer scope, so an unreconciled window can read low by design.
Why provider IDs are hidden
Customer-scoped Analytics intentionally hides provider project IDs and secret-bearing provider metadata. That is expected. The page is built to give useful usage and billing status without exposing operational identifiers. Operators who need mapped-project detail see it only in operator scope.
Billing readiness and workspace creation
Workspace creation depends on the account’s billing state. Verified paid access or an approved trial can allow create when other readiness gates are clear. Prepaid accounts also need funded workspace-time and managed-AI balances before create proceeds. Catalog funding and the readiness gates are covered in Catalog and readiness.
When you ask billing a question
For a formal billing question, include the customer account, the 30-day window, the visible totals, and the reconciliation posture. Do not include payment secrets, invoice payloads, provider account secrets, or webhook details. The Support handoff guide describes what to gather, and Troubleshooting covers usage that looks wrong before it reaches support.
Related guides
- Catalog and readiness — funding and the gates that allow workspace creation.
- Access roles — which roles see customer-wide totals and the Spending caps write surface.
- Tenant Admin for operators — operator-scoped account and tenant management.
- Support handoff — what to collect before opening a billing question.
- Troubleshooting — diagnosing usage or readiness that looks wrong.
Done When
- Analytics opens with role-scoped usage.
- The selected customer scope is correct.
- The 30-day window and reconciliation posture are understood before quoting a number.
- Billing state matches approved trial, prepaid, or paid access.
- Spending caps are saved per service and reflect the intended cap action.