


Operations
Operations center
Triage active CI, QA, bot, workspace, storage, and capacity signals from one scoped Console workbench.
Last updated
Operations is the Console workbench for account-level work that is already in motion. Open it (/operations) when you need to see active CI and QA runs, bot runs, workspace health, Shared Drive posture, retention backlog, and capacity alerts together, then jump to the page that owns each item.
Customer admins see their customer-scoped operations. Platform operators and platform admins can review broader operational scope according to their access, and operators get two extra surfaces: the ArchiBot skill reviews queue and the DevOps chat shortcut.
If you do not have customer-admin or operator access, the page shows an operator-only notice instead of the workbench.
How the page is laid out
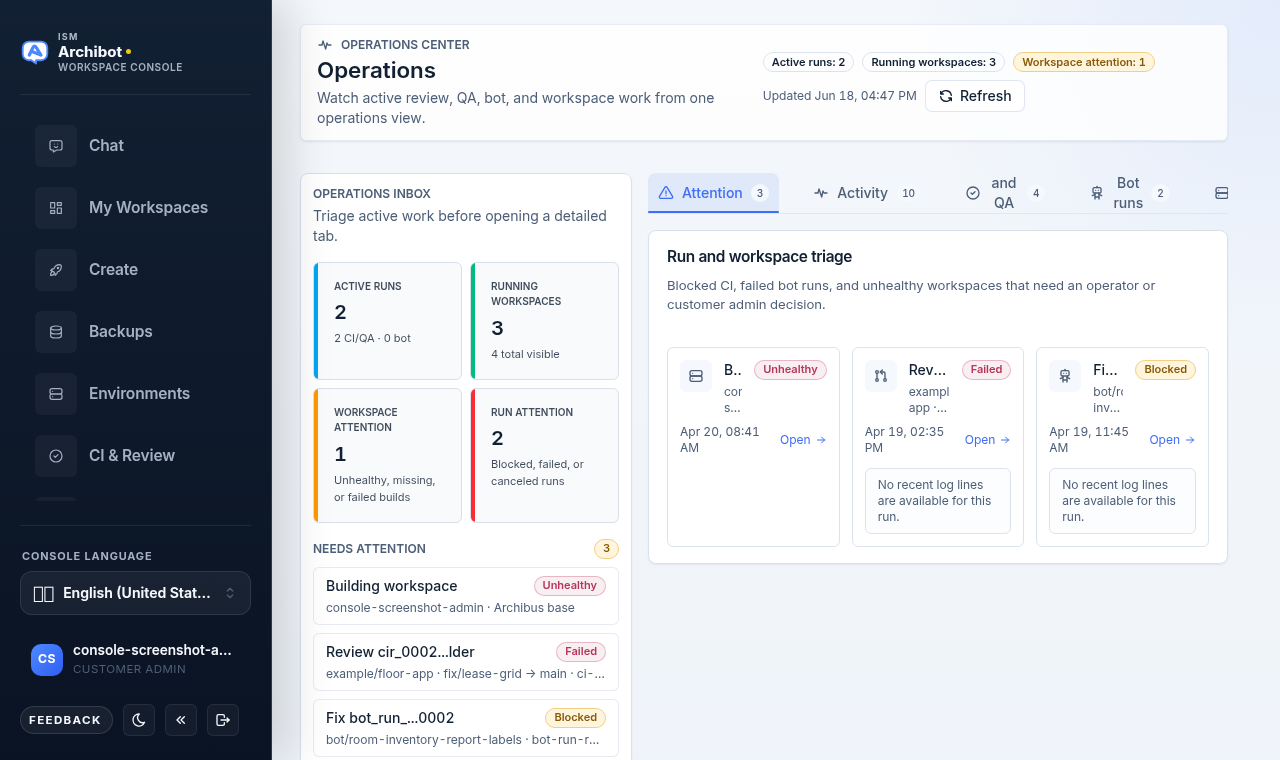
Operations is a two-pane workbench. A persistent inbox sidebar stays on the left while a tab strip on the right swaps between detailed views.
The header strip across the top shows the page title, live count badges (active runs, running workspaces, workspace attention), and the last refresh time. The data auto-refreshes about every 15 seconds; you can also force a reload with Refresh at the top right.
The inbox sidebar
The sidebar is your triage starting point. Read it top to bottom before opening a tab:
- Inbox tiles — four counters: Active runs (with a CI vs. bot split), Running workspaces, Workspace attention, and Run attention.
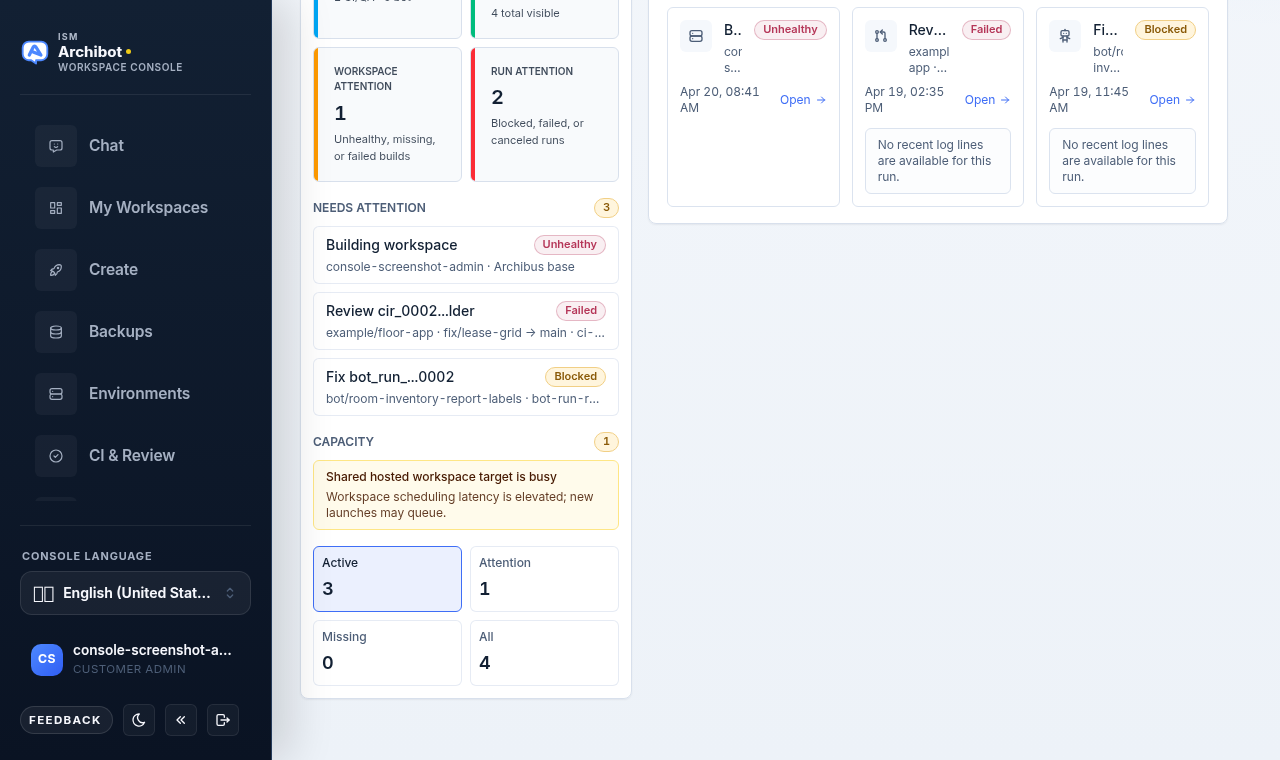
- Needs attention — the top blocked, failed, or canceled runs and unhealthy workspaces, each a direct link to the owning page.
- Capacity — a short list of current capacity alerts, color-coded amber or red, each linking to where you fix it.
- Workspace filter pills — Active, Attention, Missing, and All counts. Selecting a pill jumps the right pane to the Fleet tab with that filter applied.
The tab strip
The right pane is organized into tabs, each with a count badge:
| Tab | What it shows |
|---|---|
| Attention | Blocked, failed, and canceled runs plus unhealthy workspaces, with an inline log preview on run cards. |
| Skill reviews | Operator-only ArchiBot skill review queue (operators and platform admins). |
| Activity | Recent CI, bot, and workspace activity, filterable by Runs, Workspaces, or All. |
| CI | Recent CI and QA runs with status, linking into CI & Review. |
| Bots | Recent bot runs with status, linking into Bots. |
| Fleet | The full workspace table with filter pills and search. |
| Capacity | Capacity alerts, the capacity detail disclosure, and the operator notify control. |
Customer admins default to the Attention tab. Operators default to Skill reviews.
Skill reviews tab (operators)
Operators and platform admins get an ArchiBot skill reviews queue. It groups proposed skill and reference edits into Active, Approved, and Done buckets, with an item count on each.
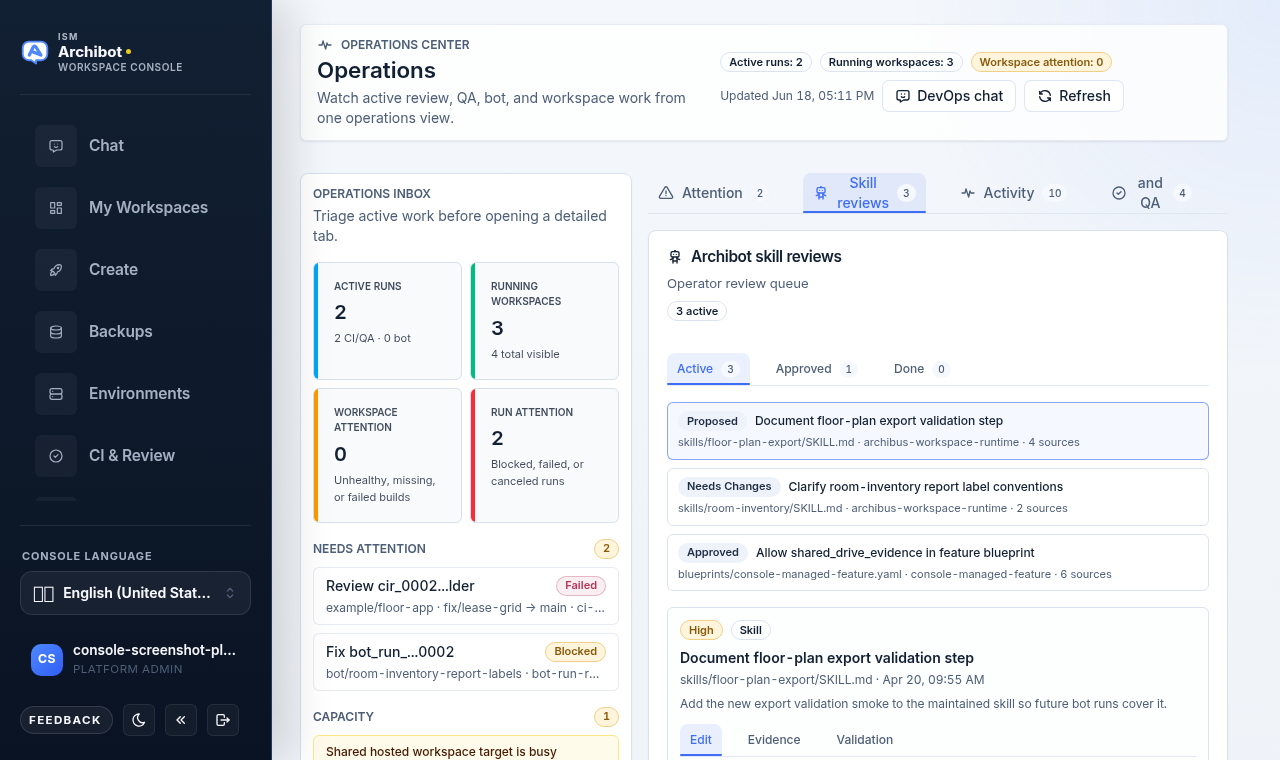
Select a review to open its detail panel. The detail has three inner tabs: Edit (the proposed edit text and operator notes), Evidence (the summary behind the proposal), and Validation (the suggested validation steps). After editing, choose Save, Defer, Reject, or Approve. Approving keeps the item in the Approved bucket for follow-up; rejecting moves it to Done.
Attention tab
The Attention tab is the default triage view. It lists every run and workspace that needs a look right now: blocked, failed, or canceled CI/QA runs, attention-state bot runs, and unhealthy, missing, or failed workspaces.
Each run card carries an inline log preview of the latest few lines so you can judge severity without leaving the page. If logs are not available yet, the card says so rather than showing nothing. Click any card to open the owning page (CI & Review for runs, My Workspaces for a workspace).
The live triage is balanced across CI/QA, bot, and workspace signals so blocked runs stay visible even when many workspace records are missing, unknown, or updating at once.
Activity tab
Activity shows recent work across CI, bots, and workspaces. Use the inner tabs to focus:
- Runs — CI and bot activity only.
- Workspaces — workspace activity only.
- All — the combined, time-sorted feed.
Each row links back to the owning surface. If a tab holds more than the visible rows, a note tells you how many more are available there. Use the Fleet tab when you want the complete workspace list rather than a recent slice.
CI and Bots tabs
The CI tab lists recent CI and QA runs with repository, stage (Review, QA, or Review + QA), short run ID, branch, and status. Each row opens that run in Persistent environments and CI Review.
The Bots tab lists recent bot runs with mode or blueprint, branch, and job name. Rows link to Console Bots (or to the linked CI run when one exists).
Operations is a monitoring and triage surface. Make detailed changes from the owning page, not from these read-only lists.
Fleet tab
Fleet is the full workspace table. Filter with the pills (Active, Attention, Missing, All) and narrow further with the search box, which matches name, owner, template, target, and status. The table columns are Workspace, Owner, Template, Status, Build, and Updated.

Workspace names link into Manage workspaces for the focused workspace. Selecting a sidebar pill is a shortcut into this tab with the matching filter already applied.
Capacity tab
Capacity alerts are meant to prevent avoidable launch failures. Review them before creating more CI, QA, bot, or persistent-environment work.
Common alert areas:
| Area | What to check |
|---|---|
| Workspace target | Target availability and scheduling readiness. |
| Cluster capacity | Ready nodes, schedulable nodes, node pressure, and pending storage. |
| Shared Drive | Storage root availability, quota use, and backup freshness. |
| Retention | CI and bot log cleanup backlog or retention worker errors. |
Expand Capacity detail to see the underlying summaries: cluster status, storage and backup posture, retention windows, and the active alerting policy (whether automatic checks are on, the cadence, the minimum severity, and the account scope).
Notify admins (operators)
When an alert is present, operators see a notify control in the Capacity card header. Selecting it queues sanitized customer notifications for the current capacity alerts.
This call runs as a dry run: it reports how many notifications would be queued, for how many customers, and how many were suppressed or skipped, without dispatching. Use dry-run review first. Do not dispatch customer notifications unless ISM support explicitly asks for it, and only when notification delivery is configured for the scope.
DevOps chat (operators)
Operators have a DevOps chat button in the header that opens ArchiBot Chat in DevOps mode for the current context. Use it to ask operational questions or draft a sanitized handoff while keeping the Operations view open.
When to use it
Open Operations when:
- A review, QA run, bot run, or workspace needs attention.
- A customer asks whether work is still running.
- You need to confirm capacity before launching a persistent environment, destination QA run, or bot task.
- You are preparing a support handoff and need the current run or workspace status.
Support handoff
For support, share:
- Customer account.
- Run or workspace ID.
- Visible status.
- Timestamp and timezone.
- Owning page link or route.
- Sanitized blocker or alert text.
Do not share raw logs, credentials, tokens, invite links, kubeconfigs, provider payloads, pod environment, database URLs, or private transcripts. See Support handoff for the full template.
Related guides
- Persistent environments and CI Review for the CI and QA runs surfaced here.
- Console Bots for bot run detail and controls.
- Manage workspaces for the workspace fleet and per-workspace actions.
- Workspace ArchiBot and Shared Drive for the storage posture behind capacity alerts.
- Support handoff for sanitized escalation steps.
Done When
- Operations is visible in the left navigation for your role.
- Inbox tiles, triage rows, and tabs match the selected customer scope.
- Capacity alerts are reviewed before launching more long-running work.
- Support handoffs use sanitized status, IDs, and timestamps only.